Mercury porosimetry: Pore volume and pore size distribution
Pore analysis forms the base for the evaluation of many materials such as catalysts, construction materials, sediments, paper or porous plastics and ceramic green bodies. Mercury porosimetry is capable of analyzing a very broad range of pore sizes reaching from 3 nm up to 950 µm. This covers the macropore region as well as almost the complete region of mesopores as well. Pore volume is measured by recording the amount of mercury intruded into the pore system while the pore size distribution is derived from the pressure dependence of filled pore sizes.
Analytical method
Mercury (a non-wetting fluid) is intruded into the pores of a solid by pressure leading to the initial filling of larger pores while increasing pressure leads to the filling of smaller and smaller pores. This dependence of pore size and pressure is traditionally described by the Washburn equation. The so-called intrusion curves allow the calculation of pore size distributions. Further information such as surface area and raw density can also be obtained.
While porometry will only characterize through-pores and thus only generate information for filters and related materials, porosimetry will acquire all pores open to ambient in any way (with minimum pore apertures of > 3nm). The biggest asset of this method is the very large range of pore sizes.
Example
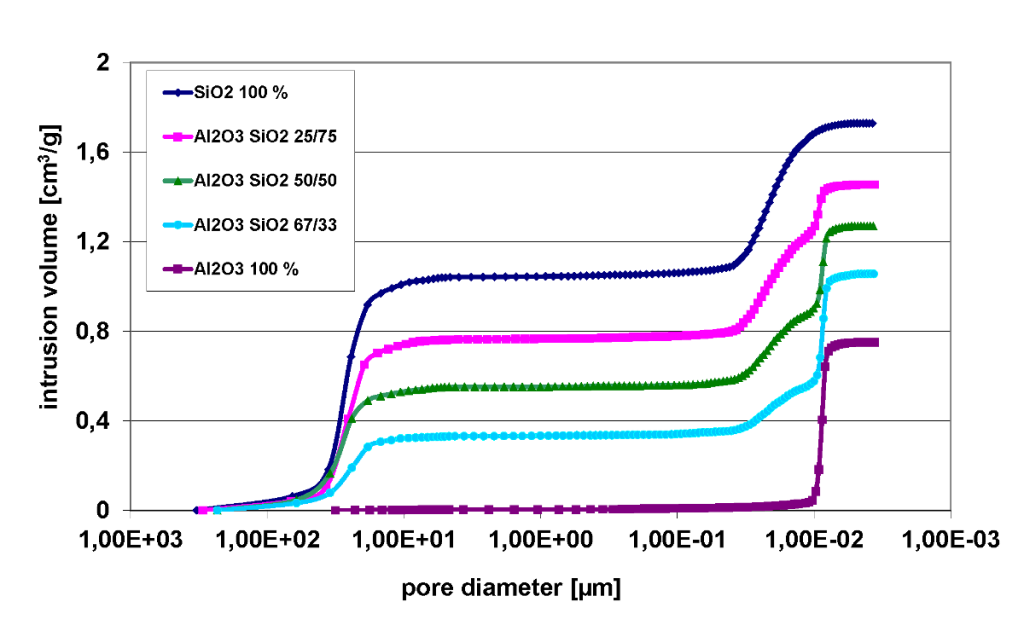
The example shown below displays the mercury intrusion curve of mixtures, e.g. silica gel (powdered SiO2) mixed with alumina oxide (granules Al2O3). Silica gel amounts are 0, 33, 50, 75 and 100 % mass percent. Pressure recorded on the x-axis rises from left to right, meaning the process of pore filling is also displayed from left to right. The analysis distinctly shows three rises in intrusion: 100 – 10 µm, 0.04 – 0.01 µm and 0.01 – 0.008 µm respectively. With regards to the particle size distribution of silica gel this data is interpreted as follows: The initial rise on the left is a result of the filling of interparticular voids. The next rise can be attributed to the filling of pores within the silica gel with the top curve corresponding to pure silica gel. The rise on the right corresponding to the smallest pores in the intrusion process is alumina oxide with the lowest curve representing pure alumina oxide.
Intrusion curves on SiO2 and Al2O3 in different mass ratio
 Deutsch
 English