Acoustic spectrometry: particle size measurement in concentrated dispersions
The particle size distribution of an emulsion or suspension is a key parameter to evaluate the quality of the dispersion. Thus the choice of a suitable size measurement method is essential for an efficient quality control of research on these systems. Many instruments and methods are on the market, but most of them like light scattering systems requires a special sample preparation/dilution due to their limited concentration range. Image analysis methods (REM, TEM, etc.) on the other hand can analyze only a limited sample amount – thus the results are not representative. Due to the fact that modification/dilution is always influencing the electrochemical properties and particle size distribution of concentrated dispersions, a suitable measurement method must be able to characterize the system in its original state without any modification.The acoustic spectrometry is a technique, which fulfil exactly this task! Concentrated suspensions like ceramic slurries, cements or paints, even paste-like, can be characterized easily in order to analyze particle size distribution and the state of agglomeration. The size range extends from nano-sized to the upper micro-size range.
Instruments
Measurement principle
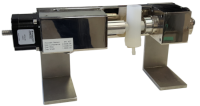
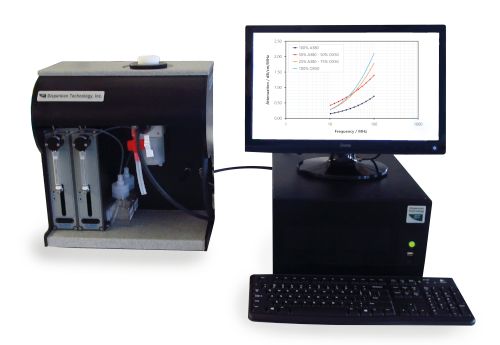
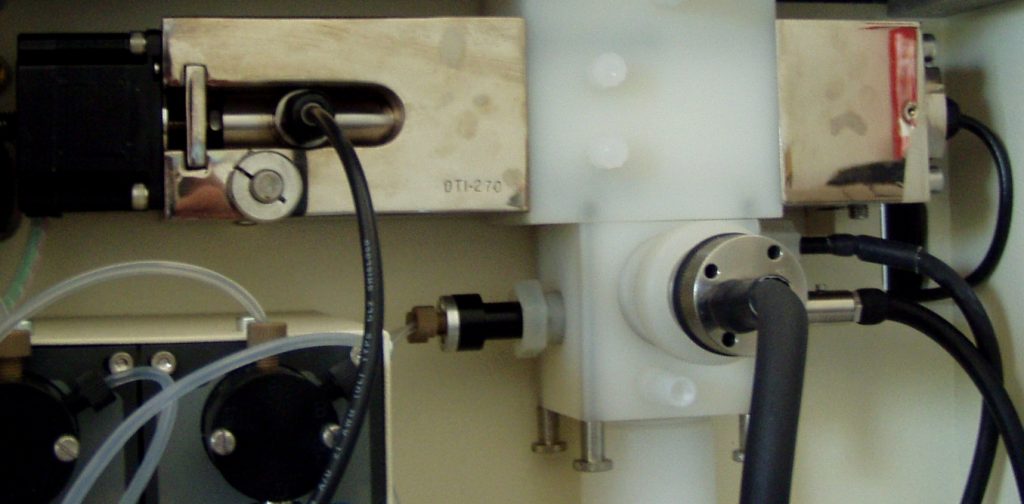
Ultrasound waves of different frequencies will be launched into the dispersion to be characterized. During transmittance of the wave through the dispersion, it will be attenuated due to different physical mechanism. The sound receiving transducer will detect the attenuated signal – the attenuation is a function of the particle size distribution. The instruments of the DT-line, DT-100 and DT-1202, are measuring the attenuation spectrum over a wide frequency-range: 1 -100 MHz. The figure is showing the ultrasound-sender and –receiver, in between the measurement chamber with the zeta potential-, temperature-, conductivity and titration-probes.
Acoustic spectrometry – measuring chamber
Further the gap between sender and receiver is variable. Thus high as well as low concentrated dispersions (0,1 – 50 vol.-%) can be characterized in a wide particle size-range (5 nm – 1000 µm). However, the focus of the method will be on Nano- and submicron particles! The samples can be either pumped through or left motionless in measurement chamber if they do not sediment or cream. Thus, online-measurements can be performed such as monitoring the grinding process of mill.
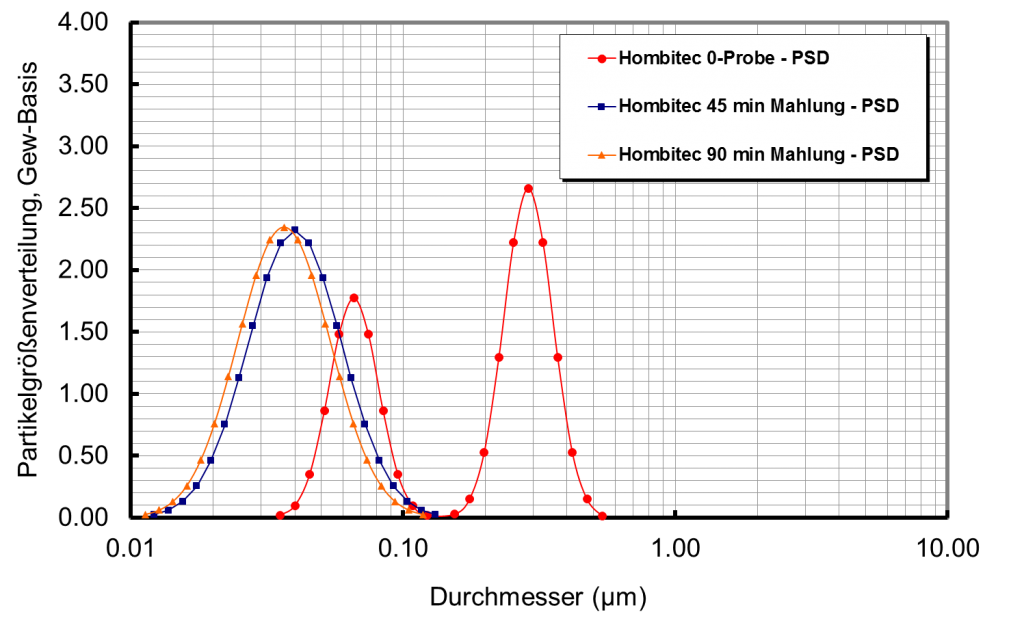
The following figure is showing exemplarily the research of a grinding process of a very fine titanium oxide (Hombitec). The shift of the size distribution of a bimodal starting product (second peak are agglomerates) down to final, primary nanoparticles (mean size 35 nm after 90 milling time) can be seen observed.
Acoustic spectrometry: particle size measurement in concentrated dispersions
References and norms
/1/ ISO 20998-1 Measurement and characterization of particles by acoustic methods./2/ A. Dukhin, P. Goetz: Characterization of Liquids, Nano- and Microparticulates, and Porous Bodies using Ultrasound. 2nd Edition. Oxford: Elsevier, 2010./3/ PARTICLE WORLD 19; p. 18 – 19; „Characterization of liquids, dispersions, emulsions and porous materials using ultrasound“.
 Deutsch
 English


