 Deutsch
 English
New: mixSorb S with 1 cc measuring cell for MOFs and other synthetic adsorbents
The mixSorb S is the new development of 3P INSTRUMENTS for the investigation of the adsorption of gas and vapor mixtures! With the mixSorb S the mixSorb instrument series is completed, S stands for “small”, that is for the investigation of smallest sample quantities by dynamic mixture sorption of gases and vapors, L stands for “Large”, that means the investigation of larger quantities of industrial adsorbents.
Significant research activities have been undertaken in recent years for the synthesis of frameworks – like pore structures. These materials were mainly studied using the classical texture-descriptive analysis methods and in some cases tremendously large BET surfaces were determined. Such studies are highly interesting, but for many practical applications these texture parameters hardly allow concrete conclusions. What is often expected in practice from adsorbents, certainly not the classic nitrogen adsorption at 77 K, right? In practice, gas and vapor mixtures have often to be separated into its components, e.g. Biogas into methane and carbon dioxide, or certain noxious substance should be separated in ppm concentration from a gas mixture (gas purification). From a BET surface area or a pore size distribution, however, it is not possible so far to predict which component of the mixture can be removed by adsorption from a gas mixture under certain conditions and to what extent. This is where the mixSorb comes in and 3P INSTRUMENTS has now succeeded in completing a series of sorption instruments for the adsorption of gas and vapor mixtures:
The volume-optimized measuring system with an adsorber of 1 cc is available for the mixSorb S (8 bar) and the mixSorb SHP (HP for high pressure 68 bar). With this analyzer of the mixSorb series, you can now get the practice-relevant measurements in your lab. Adsorber volume of 1 cc – this allows the use of small sample quantities of e.g. MOFs or other “future” adsorbents for special separation processes.
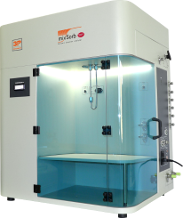
Industrial adsorbents such as activated carbons and zeolites are usually available in sufficient amounts and should be investigated in representative quantities. Practical studies of the mixture gas and vapor sorption with the mixSorb L with a standard adsorber column of 100 cc are already being carried out at a number of device users in Germany and abroad. Thus, the mixSorb series established itself as a standard sorption instrument for laboratory tests of technical adsorbents. It impresses with its flexibility in both the hardware and in the control and evaluation/simulation software.
On our homepage you will find all of our mixSorb device models:
mixSorb L – for industrial adsorbens material (up to 100 ml; up to 10 bar)

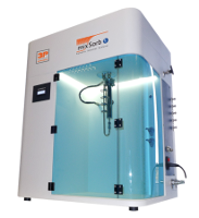
mixSorb S – for adsorbens material of R&D (< 1 cc; up to 8 bar)
mixSorb SHP – for adsorbens material of R&D (< 1 cc; up to 68 bar)
For technical suggestions on the possibilities of dynamic sorption methods on a laboratory scale, please visit:
Example measurements on the mixSorb S
In the following example, a gas mixture with volume fractions of 33.3 % CO2, 33.3 % CH4 and 33.3 % He at 10 bar, 40 °C and a flow rate of 30 cm³ min-1 was separated over a synthetic polymer-based activated carbon. Less than 0.5 g of sample were used. Helium was used to build up the pressure prior the breakthrough experiment and as the carrier gas. A mass spectrometer was used as the detector. The rollover effect for CH4 (yellow), which is known from the mixSorb L can also be seen for such small sample amounts. It can be explained by two effects:
- Concentration: Since CH4 (yellow) breaks through earlier than CO2 (red) we have some time, where only CH4 and He can be detected. Assuming a 100 % CH4 breakthrough, this would yield in a 50 % volume fraction at the detector.
- Replacement: CO2 replaces CH4 at the adsorption sites, which yield in CH4
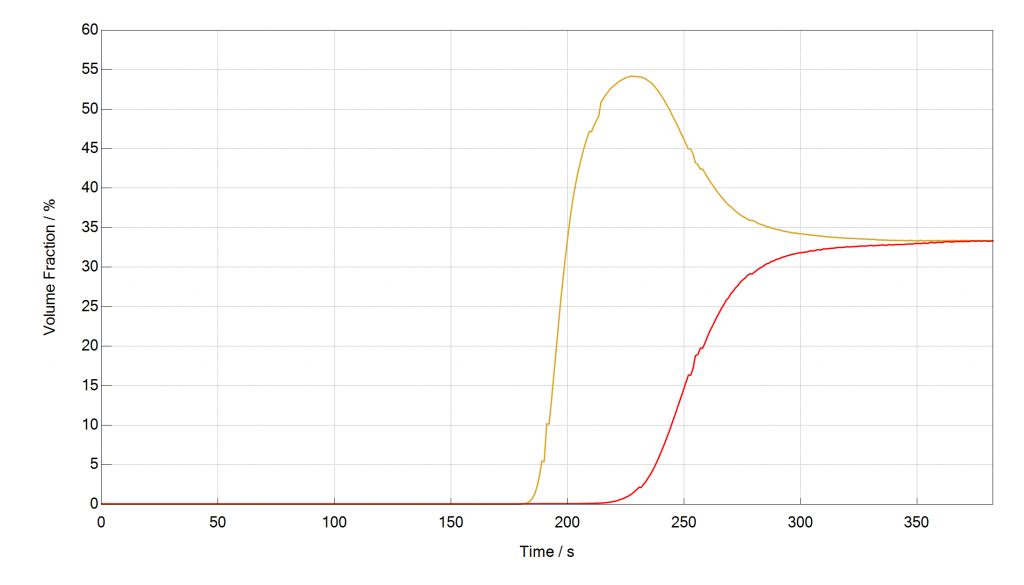
Figure: Breakthrough Curves of CH4 (yellow), CO2 (red) and He, measured with the mixSorb S
The next experiment shows a breakthrough curve of 10 % CO2 in CH4 at 40 bar ad 40 °C with a flow rate of 50 cm³ min-1 on the same sample, measured with the internal TCD.
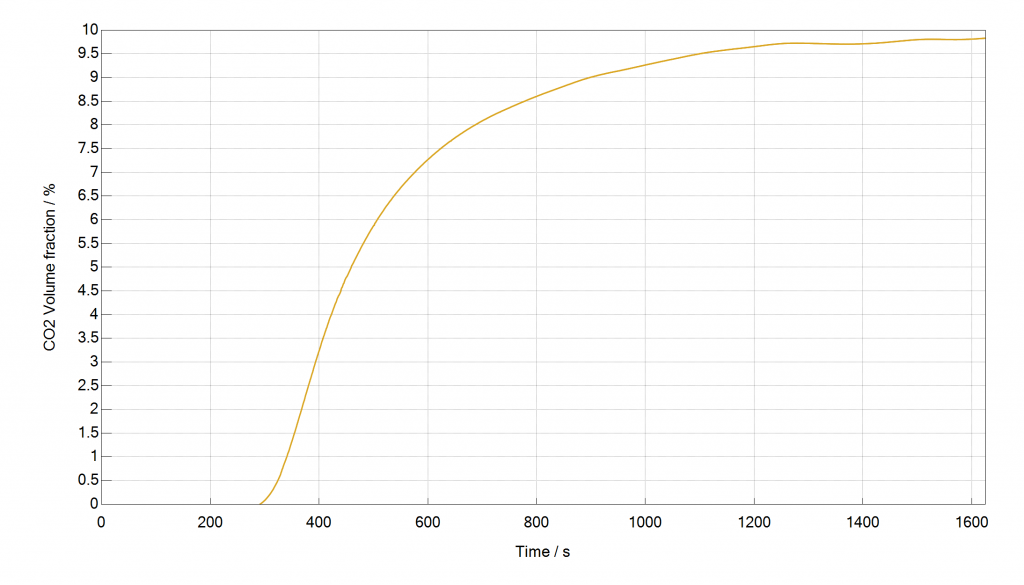
Figure: Breakthrough Curve of 10 % CO2 in CH4, measured with the mixSorb S
In a third example, we show that application-related measurements are possible with very small amounts of sample called SIFSIX-2-Cu-I that was provided by Prof. Zaworotko from Limerick University. A mass of 184 mg of sample were used in the separation of Acetylene from Ethylene (Pore chemistry and size control in hybrid porous materials for acetylene capture from ethylene; Science, 2016, 353 (6295), 141-144). A gas mixture of 10 % Acetylene and 65 % Ethylene in a Helium carrier gas were used at 1 bar of pressure and a flow rate of 40 cm³ min-1. It can be seen that the mixSorb S in combination with a mass spectrometer can deliver reliable scientific data with small sample amounts and under challenging analytical conditions. The observed rollover effect is less pronounced than for the example with CO2 and CH4. When plotting the molar fluxes over time it can be seen that this rollover can be entirely explained with the concentration effect. Therefore very little or no Ethylene had been adsorbed which speaks for a very good selectivity towards Acetylene for this sample.
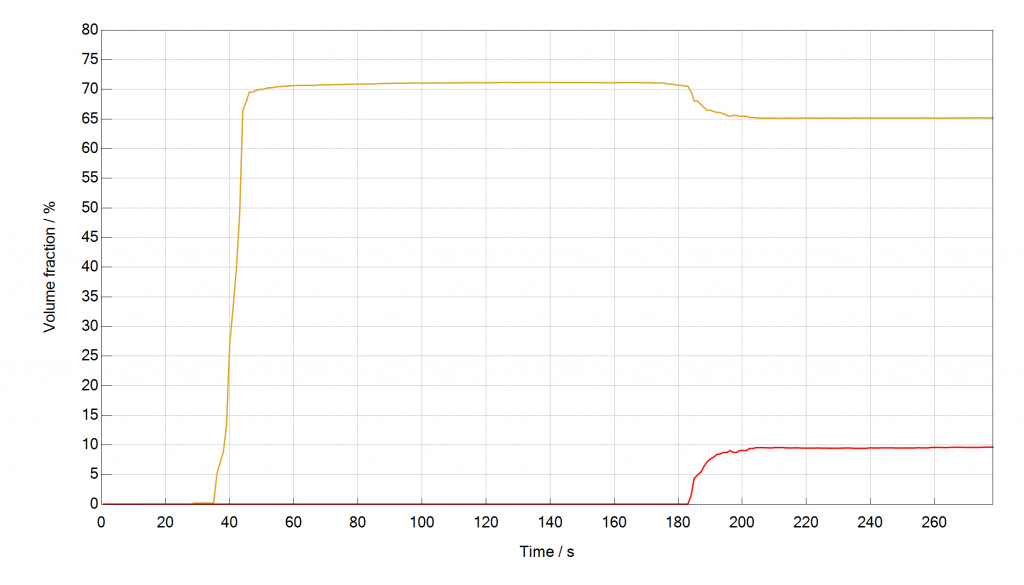
Figure: Breakthrough Curves of Acetylene and Ethylene in Helium, measured with the mixSorb S
The last example is a breakthrough experiment with 5 % CO2 in N2 at 5 bar and 40 °C on an activated carbon. The breakthrough curve was recorded, the loading of CO2 was determined and compared to mixture isotherm data, predicted with the IAST model by the 3P sim software out of pure component high pressure isotherms. The measured loading, determined with the mixSorb S shows an excellent agreement with the predicted mixture data.
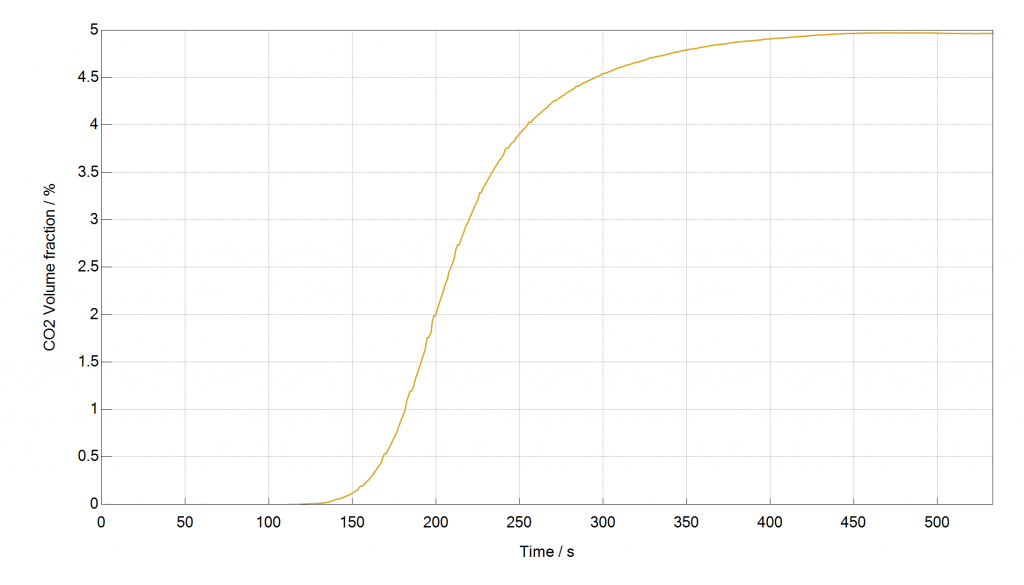
Figure: Breakthrough Curve of CO2 in N2, measured with the mixSorb S
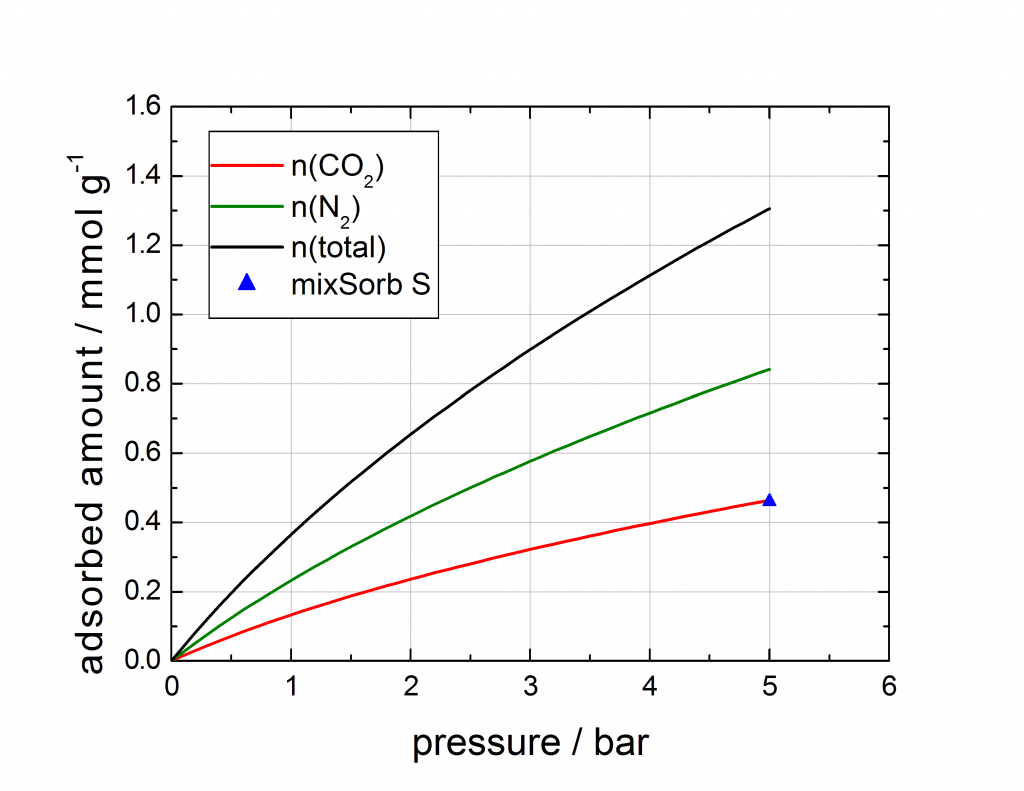
Figure: Comparison of the mixed gas isotherm point of the mixSorb S, compared with the IAST prediction calculated from pure component isotherms.
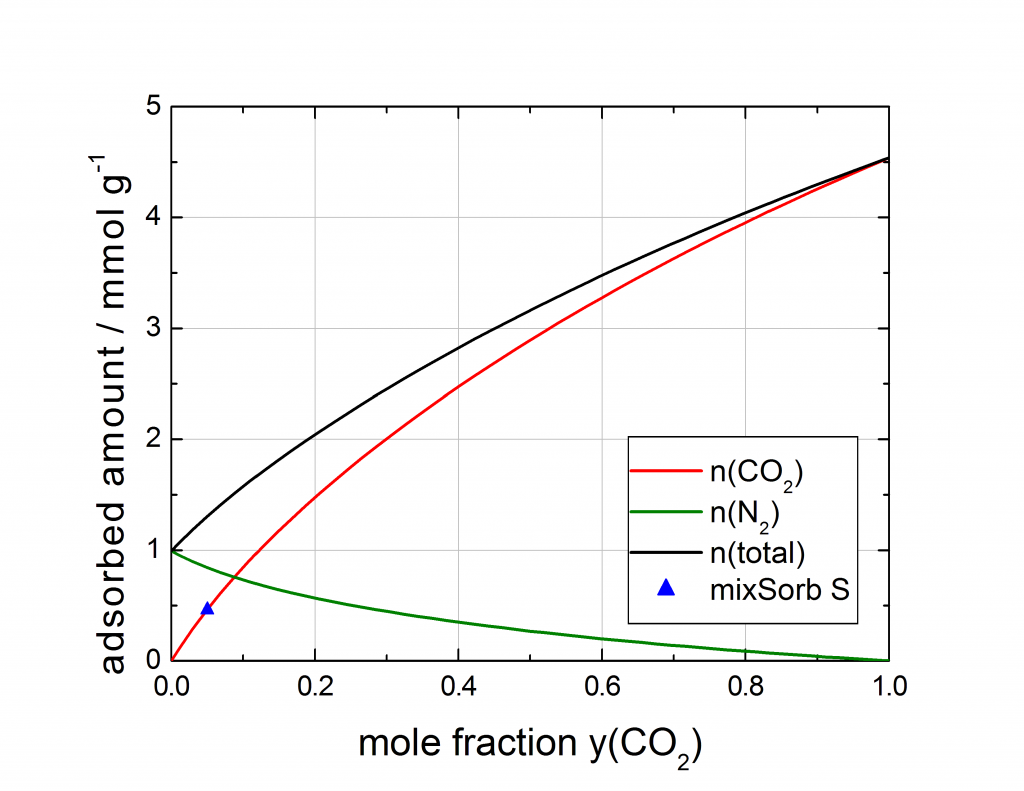
Figure: Comparison of the mixed gas isotherm point of the mixSorb S, compared with the IAST prediction calculated from pure component isotherms, composition view.
Do you have any questions about these sample measurements or are you interested in taking test or contract measurements of your material? We look forward to your call or your e-mail.
Do you like our News?
Follow us:
![]()
![]()
![]()